p and c charts
p and c charts are the control charts used for discrete data, e.g., the total count of defects per unit or the number of defective units.
p charts
p charts are used for yes/no type data. They can show, for example, the number of defective units divided by the number of total units. This kind of charts are based in the binomial probability distribution. They are valid as far as the probability p that an item "fail" is the same for all the items.
The control limits in this kind of charts are defined as follows:
| Upper control limit (UCL) | Central line | Lower control limit (LCL) |
|
|
 |
|


Where:
p is the mean proportion of defective units within the samples;
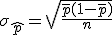 is the standard deviation of the sample distribution, with n = sample size;
and typical values for z are 2 (more restrictive) or 3 (less restrictive).

c charts
c charts show the number of defects per unit. This kind of charts are based in the poisson probability distribution.
The control limits in this kind of charts are defined as follows:
| Upper control limit (UCL) | Central line | Lower control limit (LCL) |
|
|
 |
|


Where:
c is the mean number of defects per unit;
and typical values for z are 2 (more restrictive) or 3 (less restrictive).

Complementary Excel files
An Excel file that can serve as a basis for creating p and c charts.
Licensed under the Creative Commons Attribution Non-commercial Share Alike License 3.0